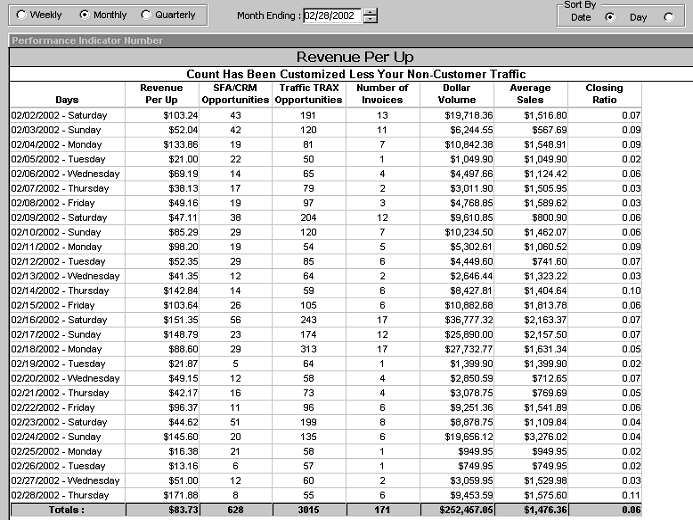
Revenue Per Up

This report provides 3 key pieces of information ...
1. Revenue Per Up.
2. Closing Ratio.
3. Comparison between the # of physical opportunities and those identified by your sales team.
Revenue Per Up (RPU) is the benchmark which provides a monetary assessment of your physical opportunities by drawing a comparison between the total sales dollars and the number of physical opportunities that visited the store. Since there are only two ways to improve the RPU which is by improving the closing ratios or the average sale ratios, you can now track this figure and know immediately if your business is improving or not.
In other words if this showroom was able to change the Revenue Per Up from $83.73 as shown in this example to $167.00 they will double their sales from $252,467 to over $500.000 Trust me, $167 RPU is not that difficult.
Secondly, this report will provide an accurate measurement of your closing ratio based on the # of sales vs. the # of physical opportunities. Often times sales people estimate their closing ratio based on only prospects who they believe will close versus all opportunities. In order to fully understand the dynamics of your traffic, the benchmarks need to be initially focused on physical traffic counts.
And lastly, by comparing the difference between the # of opportunities counted by the traffic counter and what the salespeople enter into the UpBoard, you now know how many opportunities are not being accounted for by your sales team. More importantly, you now know how many opportunities have slipped through your doors for which you do not have good follow up information for. Without good follow up information, you will not be able to "tap" your "unsold market" which ultimately limits being able to increase your Revenue per Up (RPU) through increased sales derived from this untapped market.
For example, the top line of this report show that 191 physical opportunities were counted by the door counter and only 43 were recorded, therefore 148 opportunities came in but are not accounted for. Imagine if you were able to close .07 of those customers now or in the near future by executing good follow up procedures, that would mean an additional 10 sales. Based on the average sales in this example, an additional $15,000 could potentially have been sold!
Remember - accurate measurement by itself creates awareness and the opportunity for improvement, adding intelligent management compounds this improvement dramatically!
This report can also be sorted by day, so you can look at all of your Saturdays at a single glance.
Please click the cat
Patent Pending
1. Two Questions 2 Picture of Counter in Hand | 3.Hourly Analysis | 4.Staffing Analysis | 5 Industry Experts 6 Revenue Per Up 7 Weekly Traffic Comparisons 8 Opportunity Comparisons 9 Who's Up 10 UpBoard Login 11 UpBoard Four Questions 12 UpBoard Why Didn't They 13 UpBoard Customer Button 14 Customer Info Screen 15 Problems With Manual Tickler 16 Daily To Do List 17 Automated Thank You Letters 18 Performance Summary 19 Key Reports 20 Global Traffic Trax Reports 21 Global UpBoard Reports 21a Import Export With Your Business Software 22 Major Benefits 23 Don't Ask Your Salespeople 24 SW Airlines 25 Customization Form 26 Salesperson Agreement 27 List of All Reports 28 Return On Investment Benefits 28a Getting Started and Cust Info Card