John Wanamaker (1838 - 1922)
Once Said...
Half the Money I Spend on Advertising Is Wasted -
The Trouble Is I Don't Know Which Half.
TRAX is going to show you.
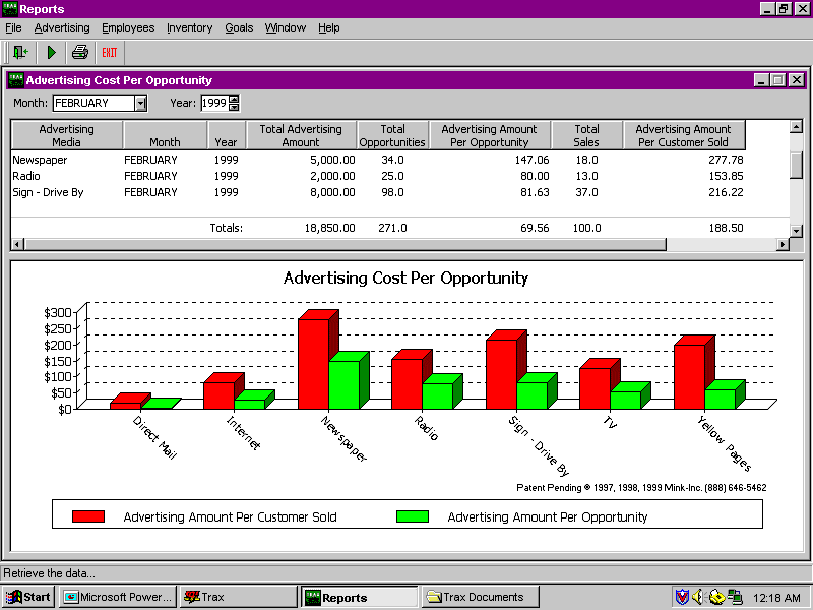
Advertising Cost Per Opportunity By Media and Unsold Customer Activity

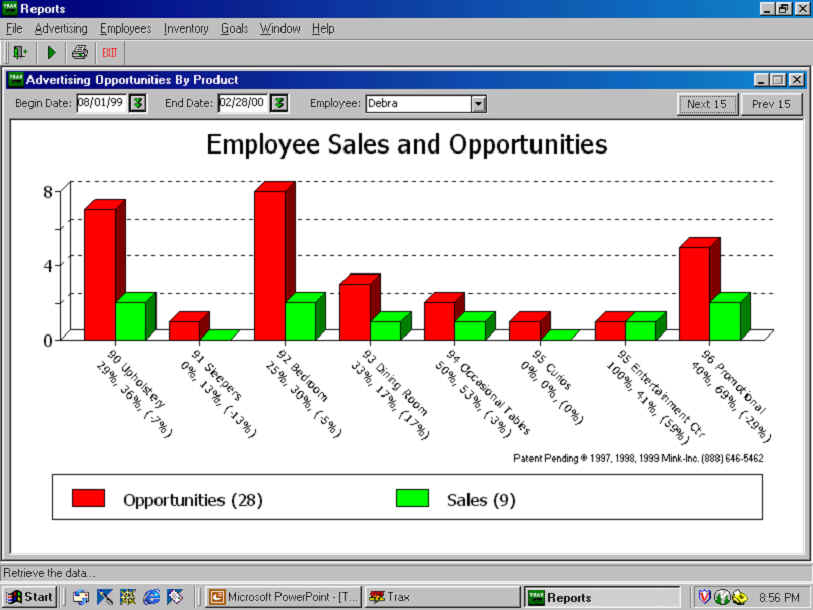
Employee Closing Ratio By Product Category
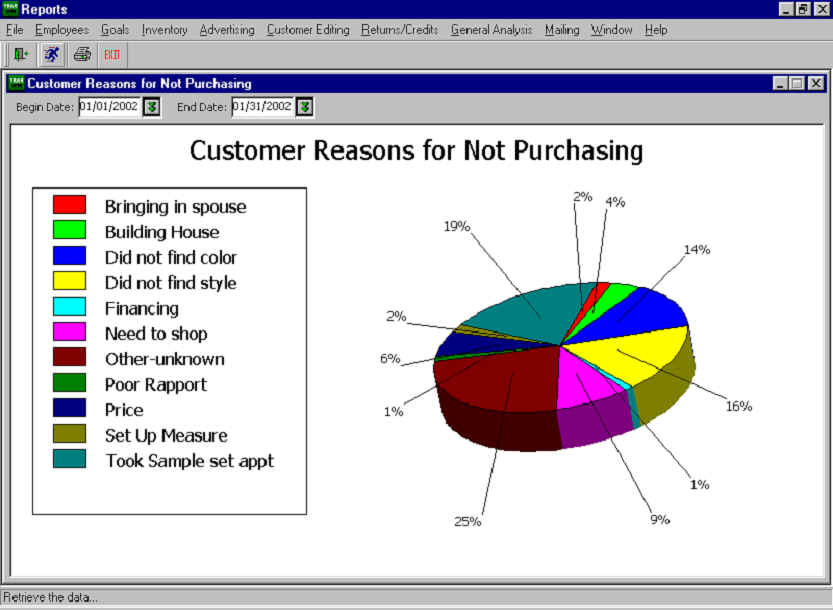
Customer Reasons For Not Purchasing
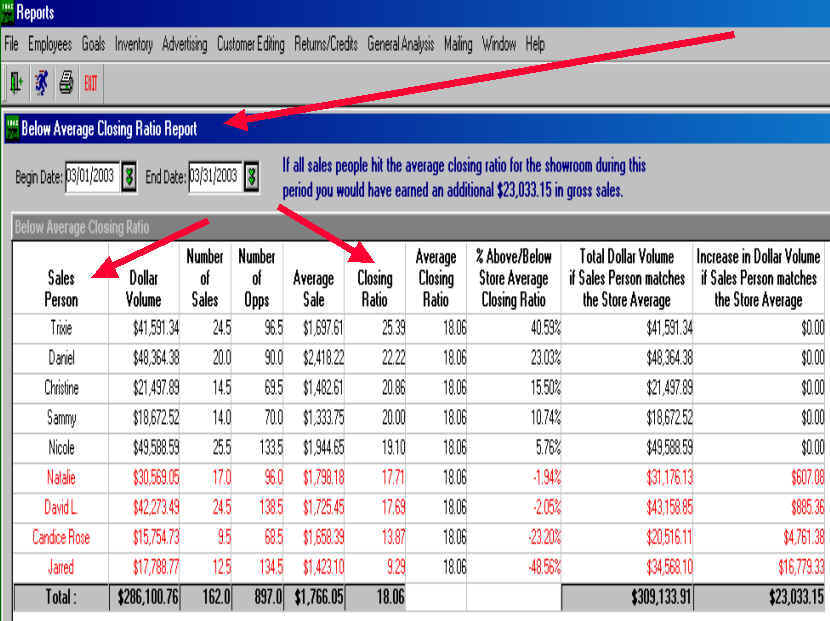
Below Average Closing Ratio
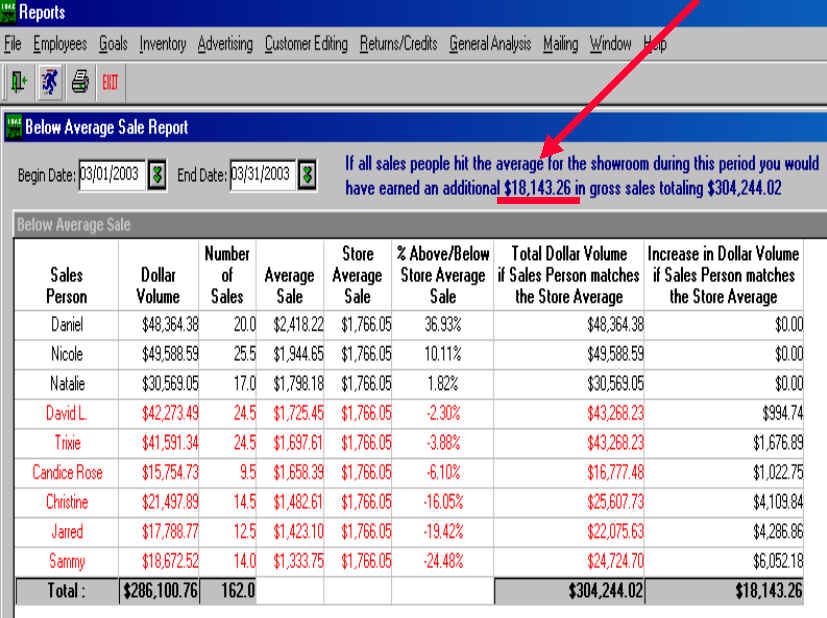
Below Average Sale
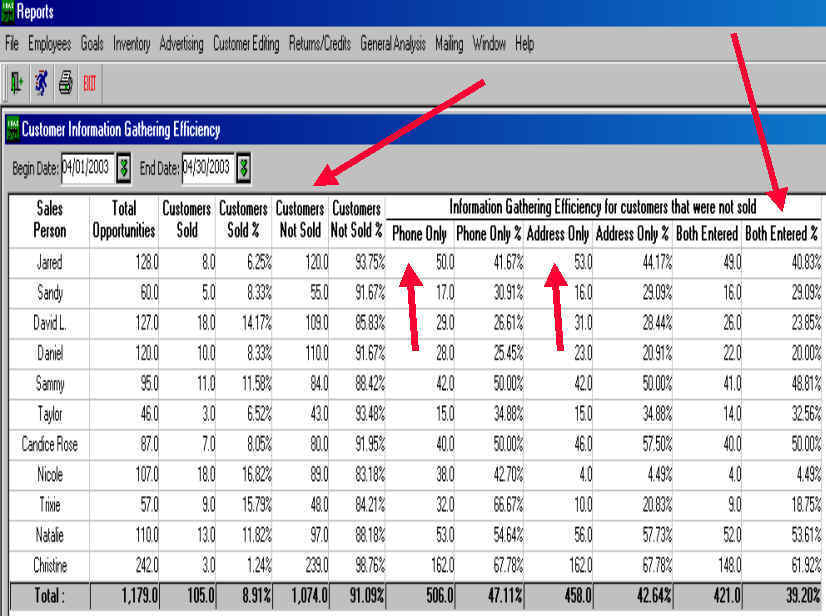
Information Gathering Report "IGE"
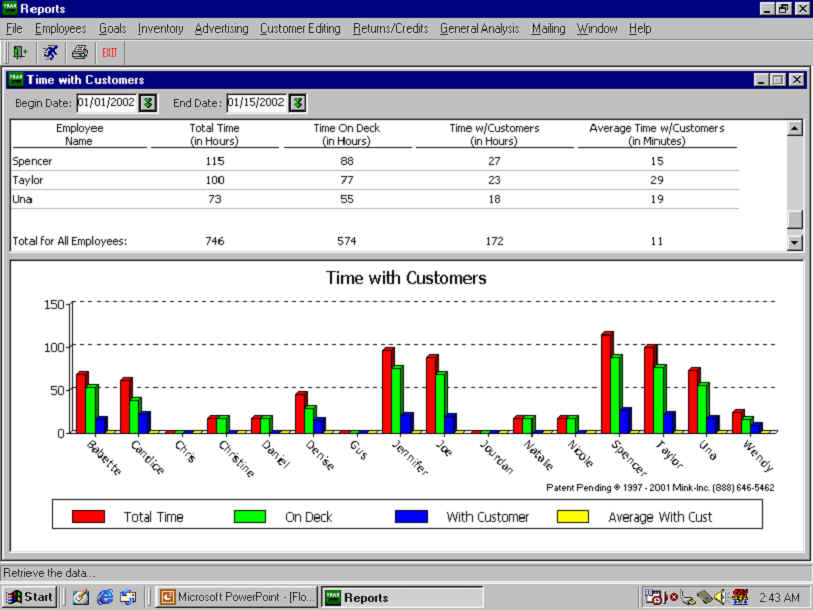
Time With Customers On The Sales Floor
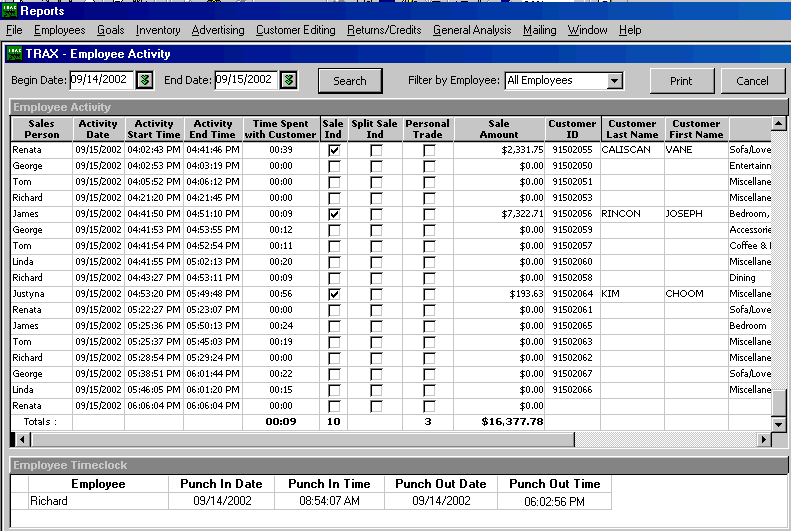
"Employee Activity" Report Guarantees Total Accuracy Everyday
(Personalized) Performance Letter
"Sample Performance Letter"
This report prints each Saturday morning @ 2:00 AM for each salesperson before your sales meeting. It may be auto printed any day you want.
Hello Nicole,
Performance
as of Thursday September 20, 2001
GOAL
Your goal for the month of September 2001 is $53,000 or 1,766.67 per day.
VOLUME
SHOULD BE
To be on goal your volume should be $35,333, so you are $5881.20 or 17% behind
Target.
SPOKEN
WITH You
have spoken with 137 prospective customers and sold 26.
TRACK
FABRIC PROTECTION, SQUARE FOOTAGE, WARRANTIES OR UNITS You had
a total of 90 pieces of Fabric Protected units and had 79 that were protected.
ITEMS
PER SALE AVERAGES Your average items per sale during this
period was 2.15 items per sale.
REVENUE
PER UP Your
Average "RPU" Revenue Per Up is $215.22 (Closing Ratio X Average Sale
Amount)
Automated Weekly Goals Tracking
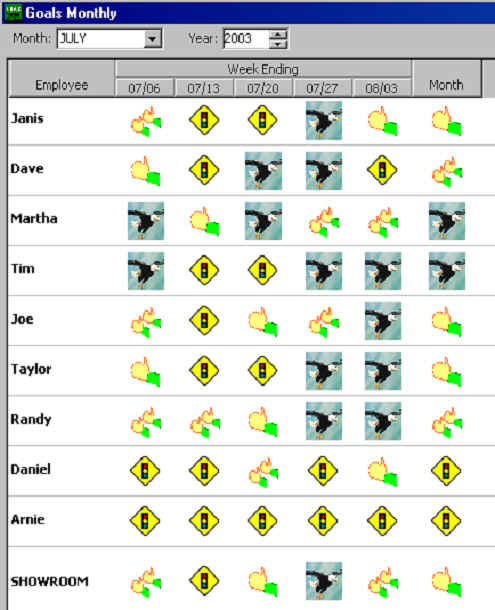

Please click the cat
Patent Pending
1. Two Questions 2 Picture of Counter in Hand | 3.Hourly Analysis | 4.Staffing Analysis | 5 Industry Experts 6 Revenue Per Up 7 Weekly Traffic Comparisons 8 Opportunity Comparisons 9 Who's Up 10 UpBoard Login 11 UpBoard Four Questions 12 UpBoard Why Didn't They 13 UpBoard Customer Button 14 Customer Info Screen 15 Problems With Manual Tickler 16 Daily To Do List 17 Automated Thank You Letters 18 Performance Summary 19 Key Reports 20 Global Traffic Trax Reports 21 Global UpBoard Reports 21a Import Export With Your Business Software 22 Major Benefits 23 Don't Ask Your Salespeople 24 SW Airlines 25 Customization Form 26 Salesperson Agreement 27 List of All Reports 28 Return On Investment Benefits 28a Getting Started and Cust Info Card