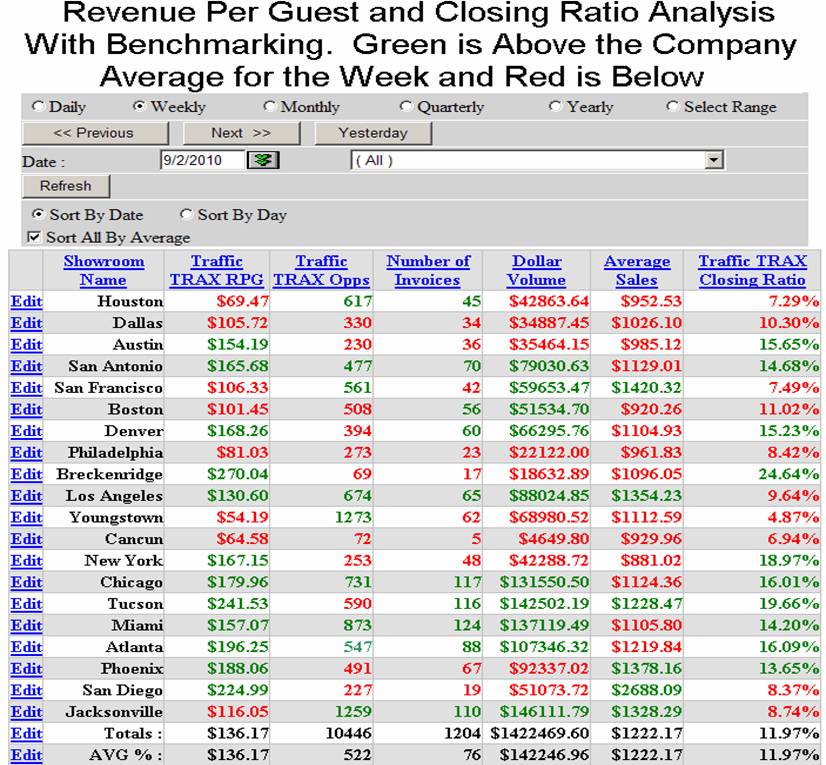
Youngstown Analysis: If you multiply the total number of opportunities
of 1273 times the RPG average for the entire company of $136.17 you will see
the true potential for this location of sales for this period of $173,344.
Compared to $68,980. This is an increase of $104,364 or an increase of
151%.
Hypothetically if you compare the potential increase from Youngstown to the
top store Breckenridge with an RPG of $270.04
$270 X 1273 = This store would produce $373,710 or an increase of 541%
Can you see how this analysis can give the average company a possible
overall increase of 20-30%
RPG Analysis for Sample Company Furniture From Thursday (
9/01/2011 ) To Saturday ( 10/1/2011 )
Monthly
Quarterly
Yearly
Select
Range
Begin Date :
End
Date :
Store Name
Dollar Volume
Number of Sales
Traffic Counter
Average Sale
Closing Ratio
Revenue Per Guest
Store Average RPG
% Above/Below Store RPG
Total Dollar Volume If Stores Matche The
Company RPG
Increase In Dollar Volume If Store
Matches The Company RPG
Chicago
$304996.73
137.0
765.0
$2226.25
17.91%
$398.69
$156.71
154%
Boston
$200252.21
221.0
1067.0
$906.12
20.71%
$187.68
$156.71
20%
Seattle
$280509.01
276.0
1692.0
$1016.34
16.31%
$165.79
$156.71
6%
Daytona
$235043.23
225.0
1697.0
$1044.64
13.26%
$138.51
$156.71
-12%
$265927.55
$30884.32
San Francisco
$200135.22
185.0
1558.0
$1081.81
11.87%
$128.46
$156.71
-18%
$244147.52
$44012.30
New York
$248623.67
229.0
1992.0
$1085.69
11.50%
$124.81
$156.71
-20%
$312169.02
$63545.35
Detroit
$82033.89
90.0
1310.0
$911.49
6.87%
$62.62
$156.71
-60%
$205294.33
$123260.44
Youngstown
$78180.01
80.0
1297.0
$977.25
6.17%
$60.28
$156.71
-62%
$203244.68
$125064.67
$1783098.66
1562.0
11378.0
$1141.55
13.73%
$156.71
$2016541.05
$233442.39
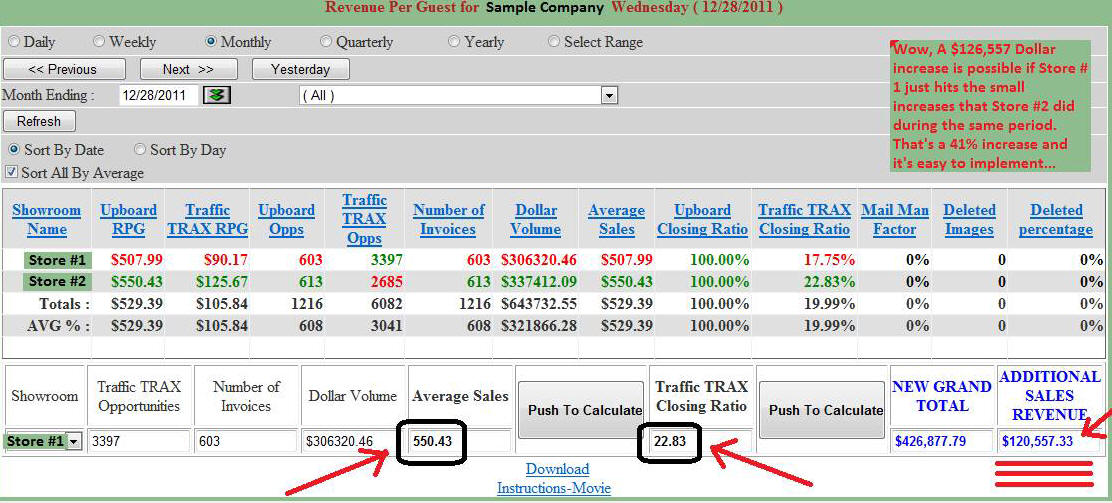
Please notice that Store #1 has more traffic and a
slightly lower Closing Ratio (5.08%) and a slightly lower Average Sale of
(8.4%) or $42.44 per Transaction.
Revenue Per
Up for Sample Company Saturday ( 4/17/2010 )
This report may take up to two minutes to populate depending on
your connection speed
Month Ending :
You have 228000.00 Sft of selling space and your MTD Dollar
Volume per Sft : $0.00 , YTD Dollar Volume per Sft : $0.00
Revenue Per Guest Comparison for Traffic Counter and
UpBoard CRM System Combined
For years so called
Industry Experts have been telling us that our closing ratios are 35-45%...
A friend of ours committed
to counting his traffic. He had nine salespeople and was generating
$600,000 per month in sales. I asked him before the count what he thought
his closing ratio was. He immediately said between 35 and 40%. This
is a very typical answer in our business. He even called in his sales
manager and asked her the same question. I smiled when she said exactly
the same thing.
After the first week we
learned that they were getting between 25-35 customers per hour on the weekend
and his overall closing ratio was 6.09 %.... WOW
He called me and
said Dave... I just realized that if I can somehow get my
salespeople to sell three more customers per hundred I can increase my overall
sales by 50%.
He now has 15 salespeople
and recently had a 1.2 million dollar month. That's double folks...and
interestingly if you do the math, each salesperson's personal level of sales
volume also improved.
This report provides 3 key pieces of information ...
1. Revenue Per Guest.
2. Closing Ratio.
3. Comparison between the #
of physical opportunities and those identified by your sales team.
Revenue Per
Guest (RPG) is the benchmark which provides a monetary assessment of your physical
opportunities by drawing a comparison between the total sales dollars and the
number of physical opportunities that visited the store. Since there are only
two ways to improve the RPG which is by improving the closing ratios or the
average sale ratios, you can now track this figure and know immediately if your
business is improving or not.
In other words if this showroom was able to change the
Revenue Per Guest from
$83.73 as shown in this example to $167.00 they will double their sales from
$252,467 to over $500.000 Trust me, $167 RPG is not that difficult.
Secondly, this report will provide an accurate measurement of your closing
ratio based on the # of sales vs. the # of physical opportunities. Often times
sales people estimate their closing ratio based on only prospects who they
believe will close versus all opportunities. In order to fully understand the
dynamics of your traffic, the benchmarks need to be initially focused on
physical traffic counts.
And lastly, by comparing the difference between the #
of opportunities counted by the traffic counter and what the salespeople enter
into the UpBoard, you now know how many opportunities are not being accounted
for by your sales team. More importantly, you now know how many opportunities
have slipped through your doors for which you do not have good follow up
information for. Without good follow up information, you will not be able to
"tap" your "unsold market" which ultimately limits being able to increase your
Revenue per Guest (RPG) through increased sales derived from this untapped market.
For example, the top line of this report show that 191 physical opportunities
were counted by the door counter and only 43 were recorded, therefore 148
opportunities came in but are not accounted for. Imagine if you were able to
close .07 of those customers now or in the near future by executing good follow
up procedures, that would mean an additional 10 sales. Based on the average
sales in this example, an additional $15,000 could potentially have been sold!
Remember - accurate measurement by itself creates awareness and the
opportunity for improvement, adding intelligent management compounds this
improvement dramatically!
This report can also be sorted by day, so
you can look at all of your Saturdays at a single glance.