The first thing we must do is
get that Top Executive on the phone with you. This will typically require
that you get through the gate keeper. How do you do this?
You should view Chet Holmes CD
#10 and #11 a minimum of three times. These are incredible training
sessions that will help you get an appointment with anyone.
When we first call we want to
ask for the Owner with a deep professional voice.
You need to avoid pitching the
gatekeeper.
When you get the conversation
with the Owner
Hello Mr. Jones my name is
Dave Mink with TRAXsales and we have a program which accurately counts your
customer traffic per hour, compares it to your staffing and helps you learn when
you are in overflow also provides you closing ratios telling you how many people
come into your stores and do not buy.
We guarantee a minimum of a
25% sales increase for the average company and if you can get in front of a
computer I can prove it to you.
The total executive briefing
is about 18 minutes plus time for questions.
Great, please go to
www.TRAXsales.com Under the big cat on
top please select Client Login, then select TRAX Presentations then please
select Traffic Counter.
Transcript of the Traffic TRAX presentation.
Rapport (40%)
They Like You, They Trust You,
They Respect You (Chet Holmes Training)
Establishing rapport with a TRAX
Customer before beginning an orientation or an (executive briefing) is critical.
Do not begin any orientation without first knowing everything you can about the
customer and putting this information in Salesforce.
Be very interested in them.
Find Common Ground. If you want to be interesting be interested.
Talk about them, not about you. Address your questions from their
perspectives and their goals. Try to mirror your client’s tonality and
body language. Learn a lot about their business.
Find the need (25%)
The deeper you understand their
need the more logical the conclusion can be. Try to find ways to make the
relationship mutually beneficial.
Start by asking the client to
tell you a little about their company. They may open up and talk quite a
bit, and let them without interrupting. We want to learn everything we can
but some key facts are important.
What are the three biggest
problems you are having in your business? Or
What areas would you like to see
improvement in?
How long have you worked for your
company? Personal but an easy one, where were you before this? What
are some of your goals for the company? What is your criterion about
buying a product like ours?
How many salespeople do you have?
They will usually always tell you how many stores they have.
How long have you been in
business?
Have you ever tried to measure
your traffic in the past? How did you do this and what were the results.
Sometimes this can be very interesting?
How much is your average sale?
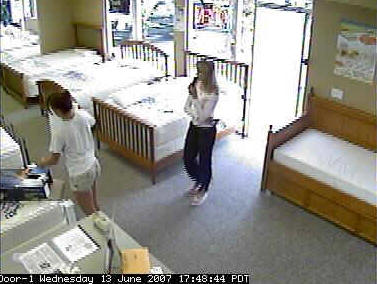
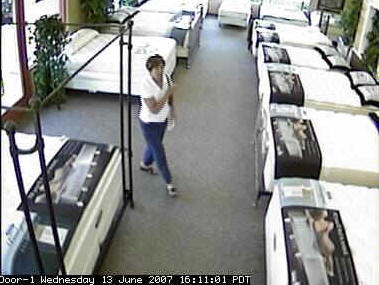
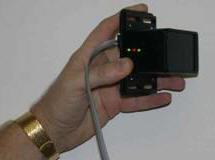
The box being displayed here is mounted at your front door. It is a very clever
device because it can tell if a customer is walking into your store or leaving.
When they walk in, they are counted, but the unit also has a four second delay.
So if it's a husband, wife and four kids, it's still only counted as one
opportunity.
When they are leaving it trips the inside beam first and it tells the
micro-processor to make them invisible and they are not counted.
Finally we also know that there is some level of customer activity throughout
the day. The mailman comes in everyday at a certain time, the UPS driver,
salespeople leave and come back from lunch. Our software automatically subtracts
for this non-customer activity. We do this so that the traffic counter reports
that you see have conservative numbers and don't include non-customer activity.
There is also a door chime that may be turned off. It will only sound when the
customer comes in. Not when they are leaving. The door chime can also only be
heard by the salespeople in the back of the store and not by the customer when
they walk in.
Have you ever heard the expression "But boss, the customer traffic died right
after you left." With Trax, it's like you are standing in the store all day long
observing the activity.
Please click the cat in the
Top right of this screen…
eTRAXsales.com Log In Page
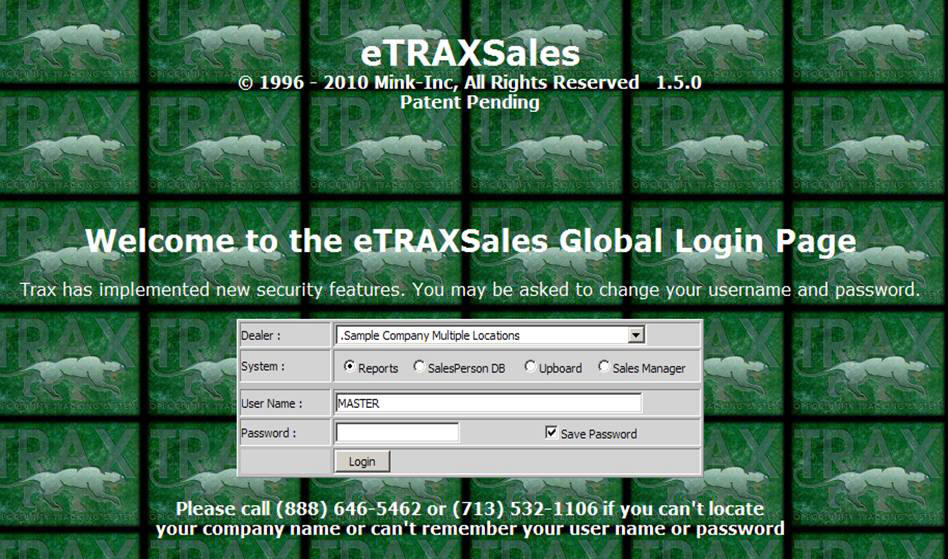
This is a sample of the log in page. You have four levels of security and will be able to view your counts from anywhere in the world 24-7.
Please click the cat and please don’t skip ahead, ok?
Traffic TRAX Drop Down List
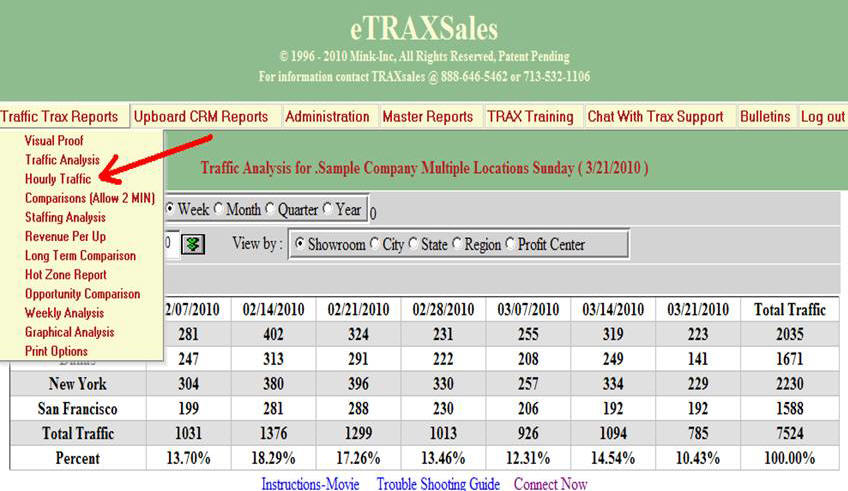
Here is an example of the drop down list with many of the reports that we provide, just to give you a feel for the layout.
Please click the cat
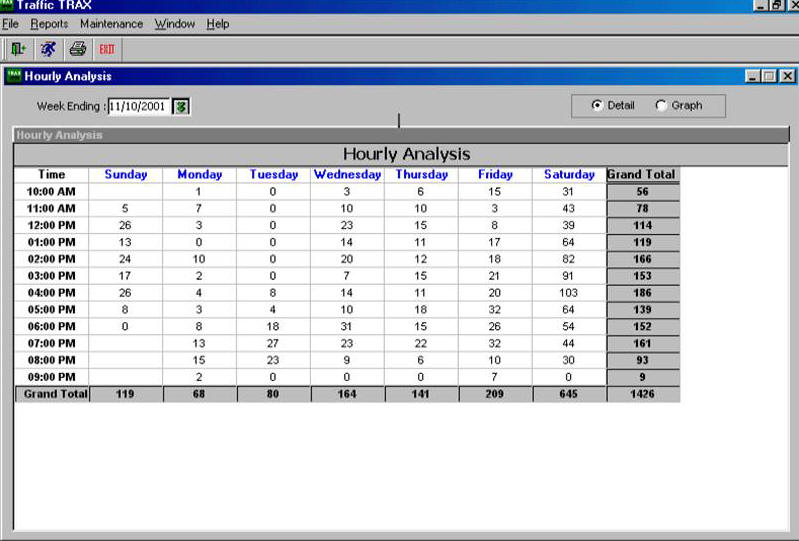
This hourly analysis report commits you to view each hour of the day and a total
for each day.
You are also able to see at a glance, your traffic patterns per hour over the
week, so you can more easily staff properly around peak customer traffic
periods. You can also easily see your total traffic from week to week and learn
if your customer traffic is getting better or getting worse.
Until now, you have been evaluating performance on sales revenue not on
potential customer traffic.
Please click the cat
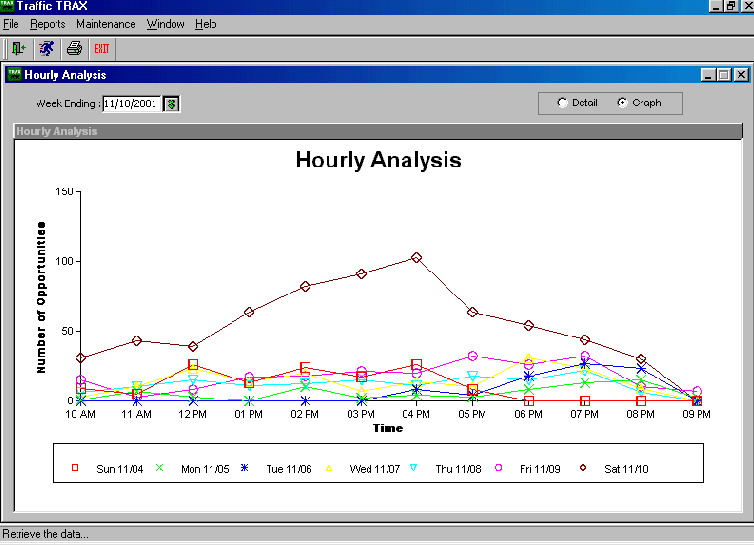
This dealer has 15 sales people and if you look at the hours between two and
three o'clock, you see that they had 91 customers that came in. Between three
and four o'clock, they had another 103 customers enter. If you total the entire
day, there was 645 customers that came in. Plus, the system automatically
subtracted 53 non-customer counts.
Do you think there is even a possibility that all those customers were waited on
properly?
The owner called me on Monday and he didn't believe it. That he was going to
hire 2 girls to take turns and manually count customer traffic. The fun part is
that we were accurate within 2% and we feel that there was a 2% difference
because the girls had to go to the restroom and we didn't.
The bottom line is that we guarantee extreme accuracy when you look at your
traffic counter reports.
|
Please
click the cat
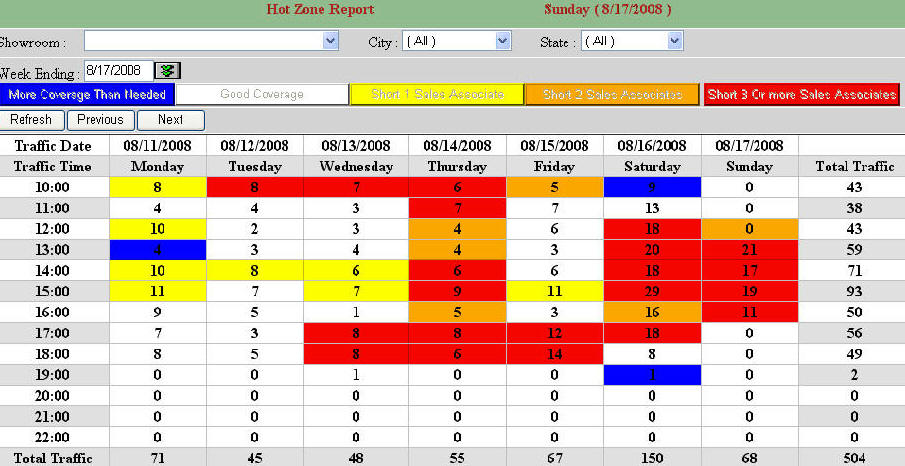
Blue = Possibly Overstaffed for that hour
White = Good staffing coverage (steady traffic with no overflow)
Yellow = Possibly short 1 sales associate during this hour
Orange = Possibly short 2 sales associates during this hour
Red = Possibly short 3 or more sales associates during this hour
|
This is the Hot Zone and is my 2nd favorite report. It
automatically compares the number of employees working each hour to how many
customers come in. We customize this based on the average time a customer
spends in your company. If you have a blue hour you are potentially
overstaffed. If you have white you are perfect, but if you have yellow,
orange or especially red you are losing money and are understaffed during those
hours. A friend who has 14 stores in the mid west shared this information
with his managers and they went back to their stores and simply re-arranged the
schedules to better cover the red hot hours. He told us that he had a 15%
immediate sales increase without adding one additional new salesperson.
Can you see how without this information you might be losing 10-15% in potential
sales?
Please click the cat
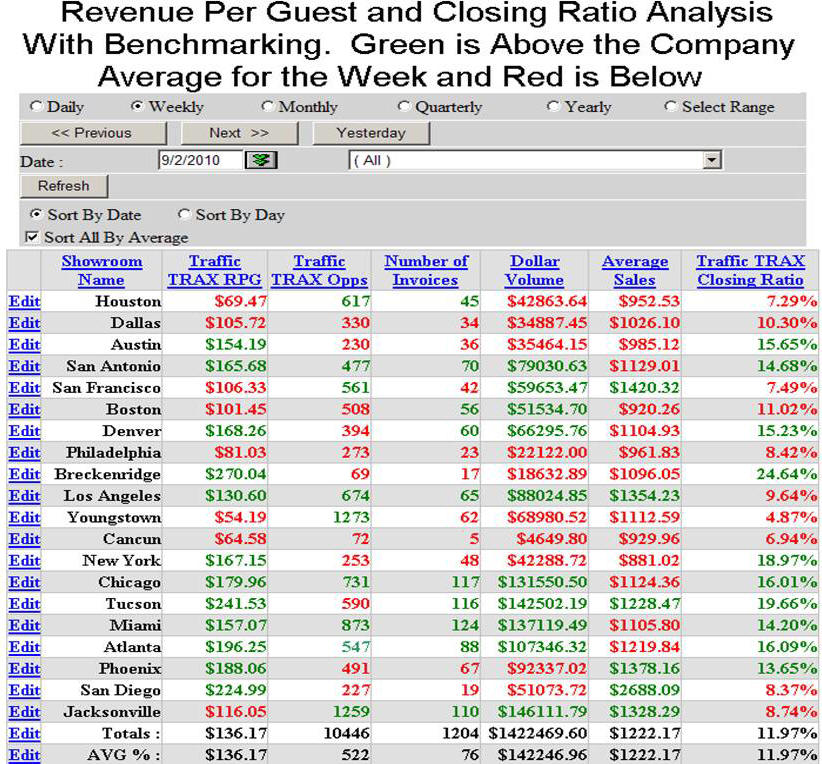
This next report is the most important management tool we provide. We call it
revenue per opportunity and it measures the potential your company has, like no
other in the history of retail.
Revenue per opportunity, quite simply is the dollar value per opportunity that
comes into your store. There are only two ways to improve this number. Either
increase your average sale or increase your average closing ratio (or "batting
average").
The primary benefit is a comparison of performance that permits you to evaluate
your company's true potential.
If you follow the top headings you see we measure RPG, total opportunities, sales volume, average sale and your closing ratio. Please notice on the bottom of this report we provide the averages for comparison. You see the avargae closing ratio on the bottom right for the entire company is just under 12% and the average sale is $1200 dollars. The magic begins when you multiply the closing ratio by the average sale and learn your AVERAGE REVENUE PER GUEST of $136. This is the average dollar value of each opportunity even if they did not purchase. Please take a closer look at the Youngstown location. You can see that their RPG is about 2 and ½ times lower than the company average. And if you look to the far right their closing ratio is also terribly low. But the most startling info is their number of opportunities which is the highest in the company.
Youngstown Analysis: If you multiply the total number of opportunities of 1273 times the RPG average for the entire company of $136.17 you will see the true potential for this location of sales for this period of $173,344. Compared to $68,980. This is an increase of $104,364 or an increase of 151%.
Hypothetically if you compare the potential increase from Youngstown to the top store Breckenridge with an RPG of $270.04
$270 X 1273 = This store would produce $373,710 or an increase of 541%
Can you see how adding this information to your daily analysis could easily double sales of poorly producing stores and companies that are measuring performance solely on gross sales without measuring their closing ratios could be losing 20-30% in sales volume every week.
Please click the cat
BABTA
|
RPG Analysis for Sample Company Furniture From Thursday ( 9/01/2011 ) To
Saturday ( 10/1/2011 )
|
||||||||||||||||||||||||||||||||||||||||||||||||||||||||||||||||||||||||||||||||||||||||||||||||||||||||||||||||||||||||||||||||||||
|
BABTA stands for “Below Average Brought to Average” and is a wonderful way to
identify your true companies potential. We use BABTA analysis for Revenue
Per Guest, Average Closing Ratio and Average Sale. As you can see here we
have ranked eight locations from the highest average Revenue Per Guest to the
lowest. As you can see the company average is $156. We simply
compare each store to the company average. If they are above the average
they are on top and if they are below they are towards the bottom. The
stores that are below the company average also display a new wonderful number
which tells you how much more they would have made if they would have simply hit
the company average. I want to stress that we are not comparing to the top
performers but to this average. The beauty here is that if you can get all
stores up to the average then the average goes up, creating perpetual
improvement.
Please click the cat
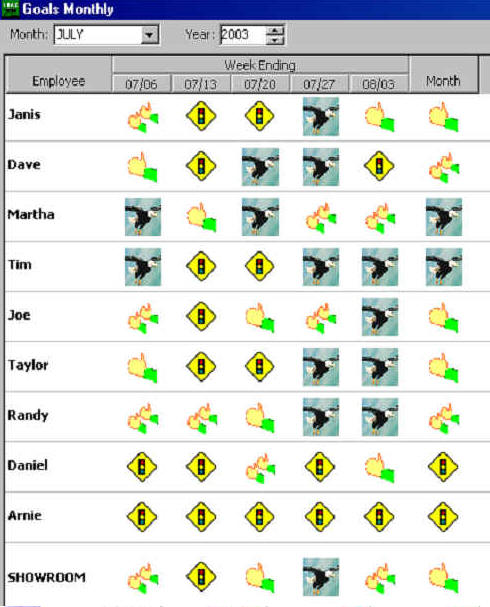
We also provide one of the best retail sales goal programs in the game. It is totally automatic once set up and breaks the goals out on a weekly basis. Most salespeople know exactly what their daily goal is. The problem with monthly sales goals is that sometimes sales associates don’t look at goals until about the third week.
Yogi Berra once said, If you don’t know where you are going, you are probably going to end up somewhere else.
click the cat
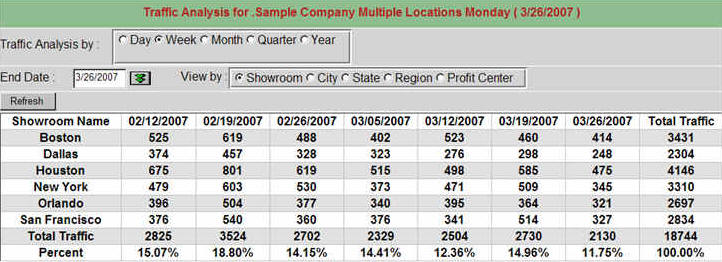
Multiple Store Report
|
|
Let's assume you have two locations that consistently do about the same dollar
volume per month. You then learn that one store has double the revenue per
opportunity. The cause is possibly is that one store gets twice as much traffic
or that the better store just has a better manager and better people. You can't
know that for sure until you investigate. In simple terms if you can create the
same level of performance at the lower performing store, you just doubled that
stores sales.
Please click the cat
Single Store Report
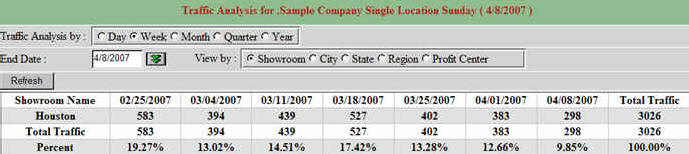
We all spend a tremendous amount of money on advertising. This report allows you
to easily compare your customer traffic to your advertising campaigns and
determine their effectiveness. Not just on sales numbers but also on traffic
flow. You are able to track each day of the week or the totals for each week.
Then you're able to see the percentage of traffic for each week and how that
relates to this entire six week period.
So for week one accounted for 19% of the customer traffic. Week two was 13%,
week three is 14%. Then all of a sudden it dropped to 9% in week seven. It
forces you to ask "what happened?" Was there a major weather event, a competitor
that opened a new store and drained off all your traffic with their advertising?
It doesn't tell you what happened but it forces you to analyze what's going on.
The real power of this report lies in the comparisons. Let's assume you
have two identical stores that have been producing the same volume of business
for years. You then learn that one showroom sees nearly double the traffic as
the other. At first it's a shock, until you realize the potential business you
just discovered.
·
You
Have 47 Entries Today
(How many are not customers???)
Simply Click
Delete
and push this button when you are done
These deleted photos are saved so you may double check to make sure the removals
are accurate.
(it's easy to scroll through 2-3 per frame)
|
Total number of photos for this Tuesday was 47 |
|||||||||||||||||||||||||||
|
|||||||||||||||||||||||||||
Finally the reason we can guarantee 100% accuracy is with Visual Proof. Here we can (in less than a minute) remove the non customer pictures. The counts are also automatically removed in the proper hour when they occurred so all of your reports are 100% accurate. We suggest that an assistant manager at each store be responsible for this simple task because they cannot tamper with the accuracy because the pics are never totally removed. You also have the choice of having the system automatically removing the percentage each hour. Once you determine exactly what your Mail Man Factor is this is the easiest way to have accurate counts without any human intervention.
To Recap
Are you the type of person who wants to create improvement in your company with
the latest and most accurate statistics?
Are you the type of person who wants to break all sales records and double the
performance of your below average stores?
Did you see without the Staffing Comparisons and the Hot Zone reports you could
be losing 10-15% in sales right now?.
Did you agree that the Analysis with the Revenue Per Guest and closing ratio
comparisons for each store could possibly increase sales by 20-30%
The regular price of a single store is $2950 plus installation and Maintenance
is 15% of the total price per year.
November special 1st year maintenance free and $2495 per unit including installation.