The following is a training transcript of our 9 minute flash movie... Why The TRAX Automated UpBoard Will Help Your Sales Team Close More Sales In Five Days
All retailers are good at capturing information on the sales they make. Trax gathers the important information on the sales you do not make.
Do you use a rotation or an “up” system? Most of us use a paper system that tracks which sales person speaks with the next customer. We can prove that a good up-system guarantees better customer service and ensures that every customer is greeted, unless you are in overflow.
We promise that if you use this system, you will se dramatic improvement on your sales floor. We promise a minimum enhancement of 5,000-10,000 dollars per salesperson, or we buy it back. We further guarantee that this simple system will triple the effectiveness of your management team.
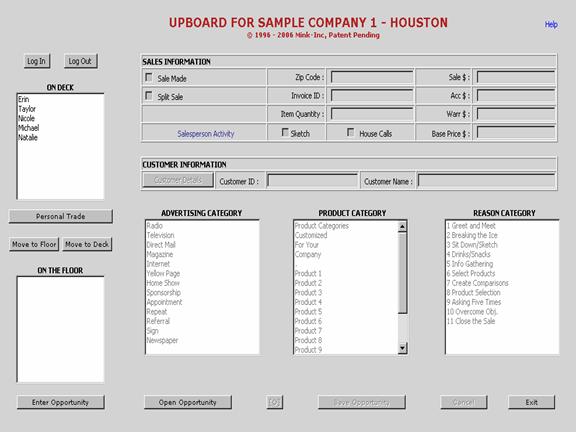
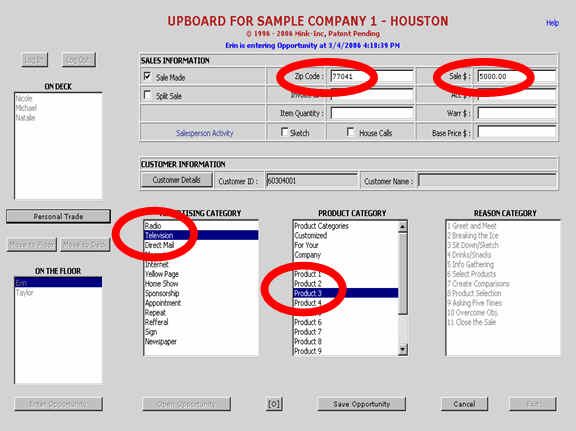
This simple screen is what the sales associates use all day long. When they arrive in the morning they log in. This is also a multi-function time clock that provides many powerful reports.
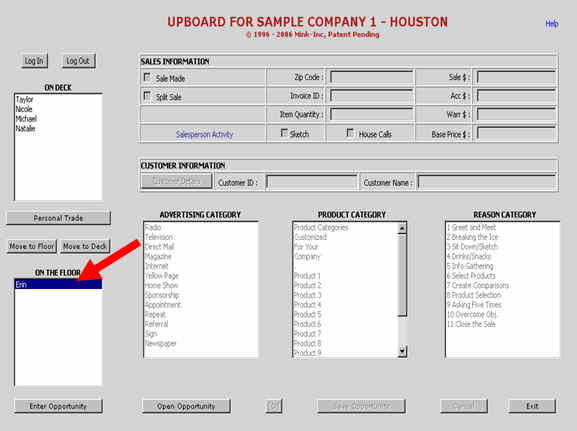
When a customer enters they move their name to the floor and it will track their average time with customers and average sales per hour. It even measures downtime.
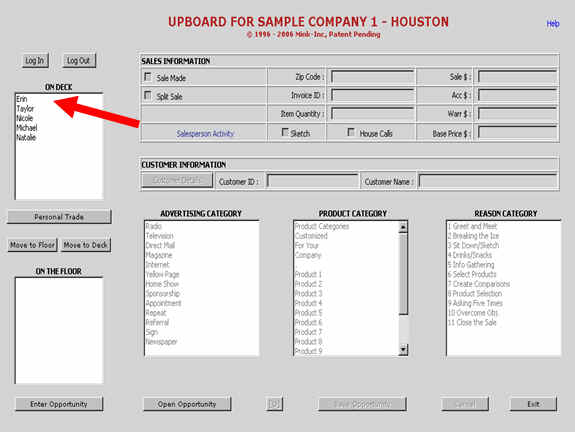
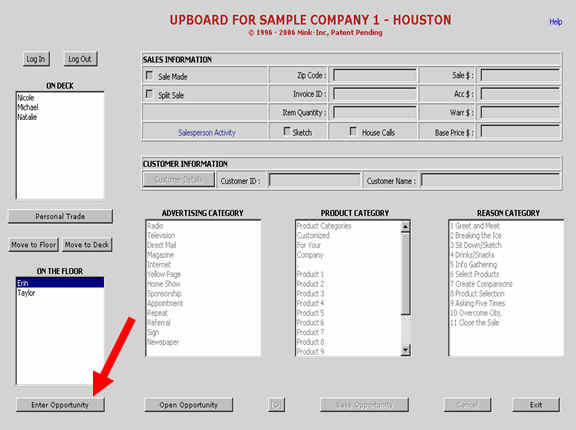
The patented part of the program is that after the customer leaves, the sales person must answer 4 basic questions to get back in rotation. We want to know what kind of advertising brought the customer in. what specific product or product categories did the customer look at, if the sale was made how much. What’s the zip code? If there was no sale made, how far did the sales person get in the selling process? You then hit save and the salespersons name goes back on deck and they are ready for their next customer.
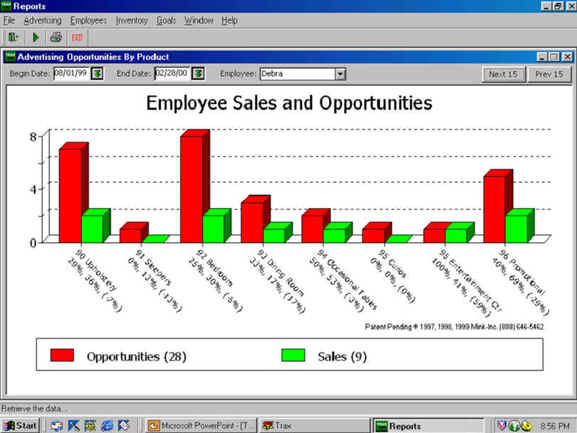
What you just learned is how many opportunities the salesperson has spoken with and what their personal closing ratios are. Which types of advertising are working and where you may be wasting your advertising dollar. What is your closing ratios by product category, by salesperson, and easily determine their strengths and weaknesses on the sales floor.
This simple 5-10 second process provides you over 50 new reports that your current software cannot provide.
This next feature is why your sales people will love this product!
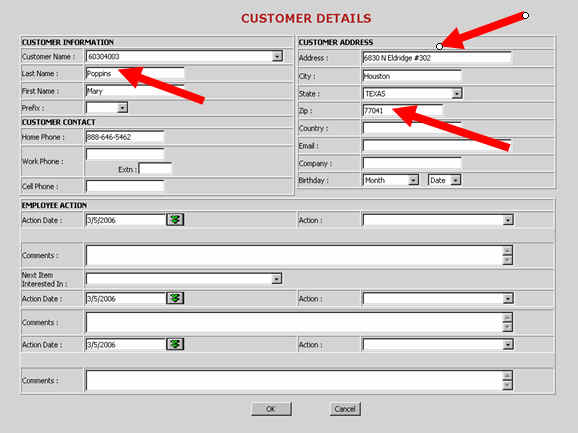
When you put in the customers name, address and zip code, the trax program automatically generates beautiful thank you letters. It will generate 3 different types of letters, one for un-sold customers, one for sold customers and it automatically generates birthday letters. These are automatically waiting for each sales person the following morning. All that’s required is a personal PS from the salesperson.
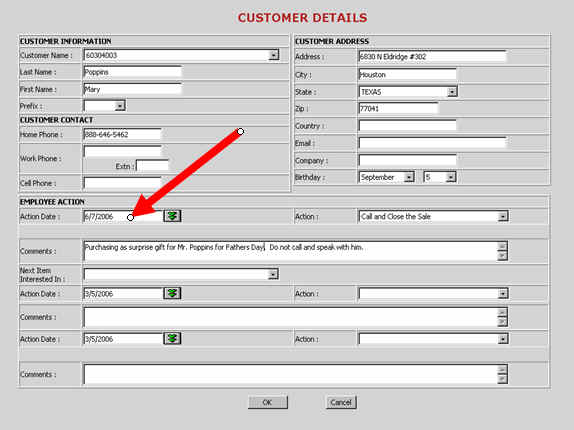
The most important part of this entire system is this next feature called the “action date” when a sales person uses the action date the system automatically prints a daily to do list for each sales person and a master for the manager. Your sales people will never miss a promise made or a follow up opportunity again!
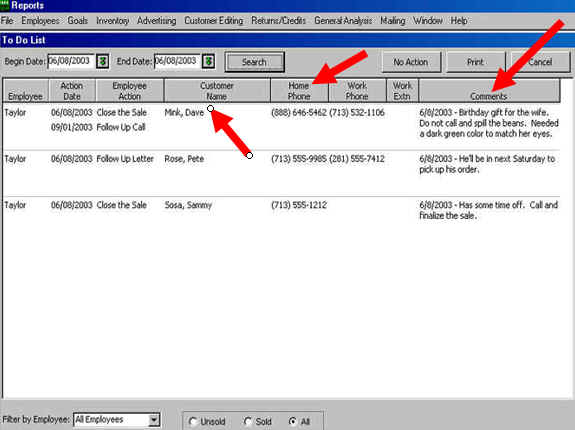
Here is a sample of the daily to do list. It shows you the customer’s name, telephone numbers and a note with exactly what you need to do to turn them into a satisfied customer.
Automated customer follow up has many benefits. It replaces hard to use manual tickler files that sometimes leave the store when a salesperson changes jobs. It’s like giving each salesperson their own personal secretary, so they never miss a promise made again! You can use this feature to follow up after a sale to insure total satisfaction or to track loaners or samples that customers will need to return.
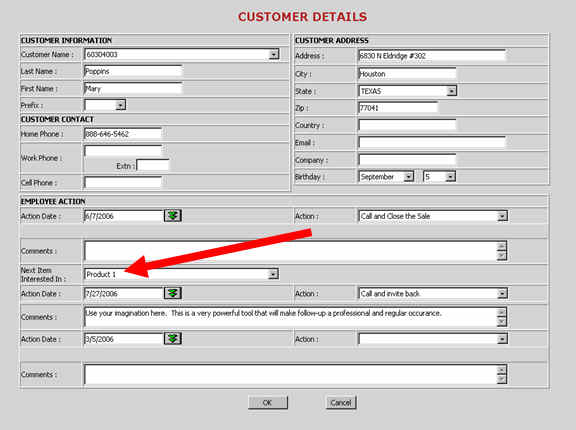
The next item is a very important automatic function. The biggest opportunity salespeople miss every day is simply asking the customer who just purchased what the next item they may be interested in purchasing might be. The truth is that if a good job is done here then additional sales can be made on the spot. Certainly this is low hanging fruit and with a good follow up plan can double a low producing sales person’s performance.
Do you believe that is costs 7x more to bring in a new customer compared to every dollar spent selling an existing satisfied customer? Do you believe that 40% of all customers that purchase do not make the purchase in the same year that they first began to shop? Do you believe that 75% of the people that make a satisfactory purchase do not return to the same store for their next purchase? The primary reason, of course, is that there has been no loyalty developed.
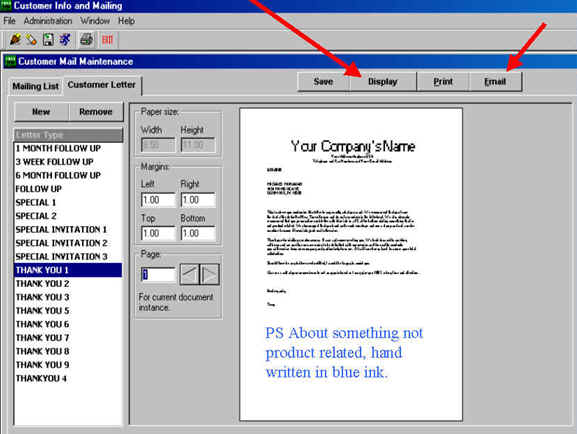
This is a sample of the automatic letter follow up screen. Imagine being able to send a high quality follow up invitation to all unsold customers for a private sale. You can also sort all these old customers by product category. We have many dealers that have a private sale every 60 days and do more business in a single weekday then they do on an average weekend!
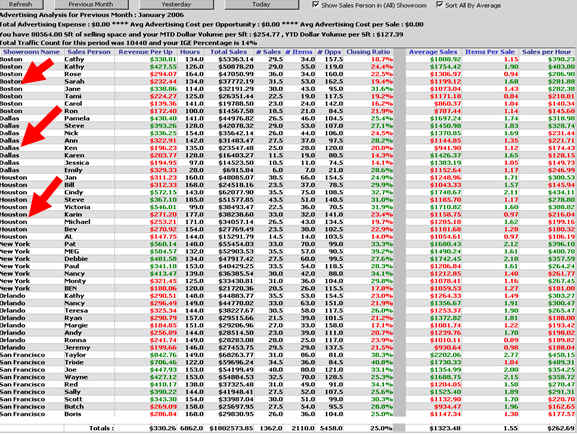
What you have just seen is why we guarantee that every sales associate will make an additional 5000-10000 per month in new business. We also promised that we would triple the effectiveness of your management team, here’s how: We think you’ll agree, that the daily weekly, monthly, performance summary reports by sales associate is the most important management summary report ever created in the history of retail.
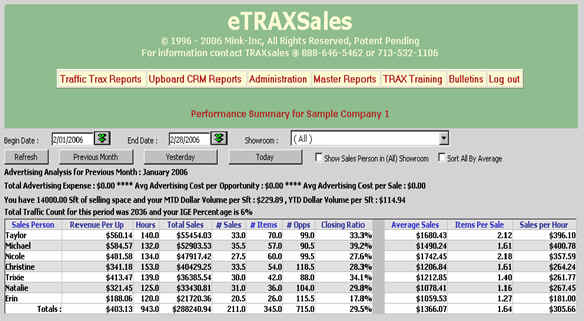
First of all, it gives you a complete analysis of your revenue per up by sales associate. This is a critical number that is the dollar value of each opportunity that visits your company. It is calculated by multiplying your average sale by your closing ratio or “batting average”. If your closing ratio is 20% and your average sale is $1000, your RPU is $200. This number provides a level of comparison and performance analysis that tells you how good you really are on the sales floor There are only 2 ways to improve this number. Increase your closing ratio or increase your average sale. It tracks each person’s total hours worked, their total dollar volume and the number of sales they made, how many items they sold, your total number of opportunities, so you of course have your closing ratio. It tracks your average sale, items per sale and your sales average per hour.
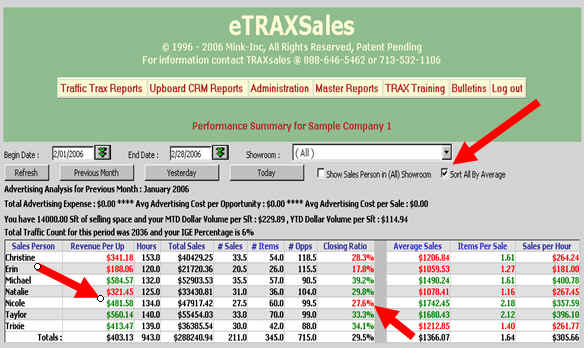
Each of these heading can be sorted in ascending or descending order for very easy analysis and comparisons. We also provide automatic benchmarking which permits you to sort by the average and compare each individual to the overall store averages. If they are above the average the number is green. If they are below, it’s red. If you have multiple showrooms you can easily create immediate benchmarking for each salesperson compared to the averages for the entire company.
This performance letter prints each day of the week, or just once a week for each sales person before your sales meeting. It lets you know how you are doing in relation to the goal you have set for the month. If you are above or below target, it tells you exactly where you stand. How many customers you have spoken with and what is your personal closing ratio and average sale. How many more customers do you need to talk with this month in order to hit your goal?
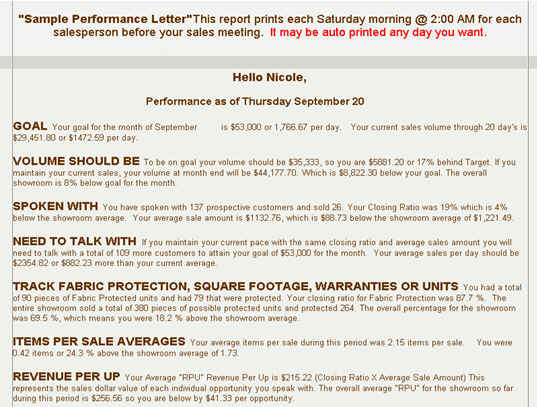
This paragraph is customized for your specific company. What are your average items per sale and how do you compare to the rest of the company.
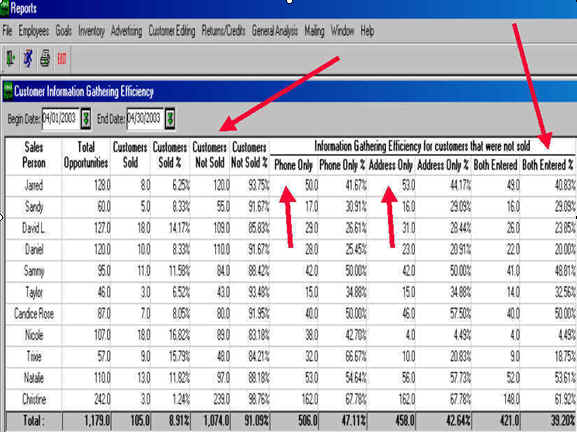
And finally and most importantly, in our opinion, what is your average revenue per up or opportunity. This report is called the IGE (Iggy) or info gathering efficiency report. We know that 99% of the time, you get customer information when you make a sale. How many times do you get the information when you don’t make a sale? The goal is 50%.
Trax has many great reports that will knock your socks off! Here are just a few:
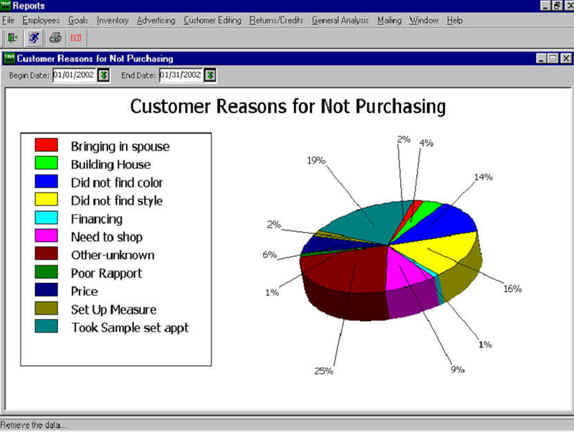
What are the reasons customers are giving your sales people for not purchasing?
What are each salespersons personal strengths and weaknesses on the sales floor?
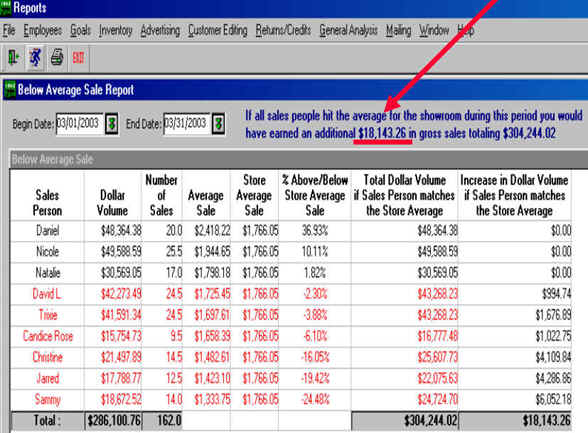
This report displays how each salesperson is doing based on their average sales compared to the company and displays how much the company would make if everyone below average simply hit the average. We also do the same report for closing ratios and RPU.
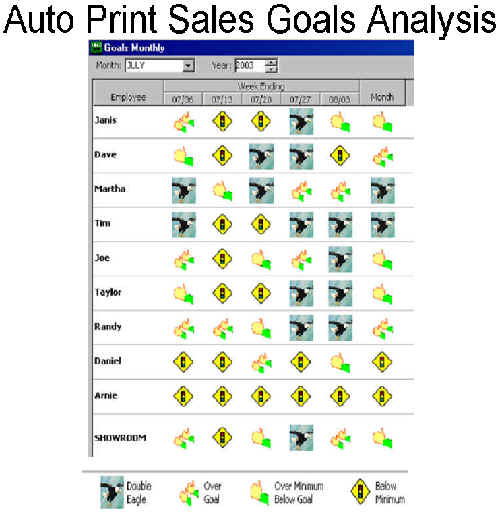
Most retailers measure their sales goals on a monthly basis. The problem with this is that most people don’t look at their sales goals until about the 3rd week, and by then it’s too late.
This report prints weekly. When you are over goal, you get two thumbs up. If you are below your goal, but above the minimum, you get one thumb up, and that’s still good. If you are below the minimum you get a yellow caution sign. Please believe me, if you get three yellow caution signs in a row, it really gets your attention! And finally if you are way over goal, based on a percentage that you set, you get a double eagle!
We also have front door traffic counters that provide accurate hourly analysis reports that will synchronize with this up system.
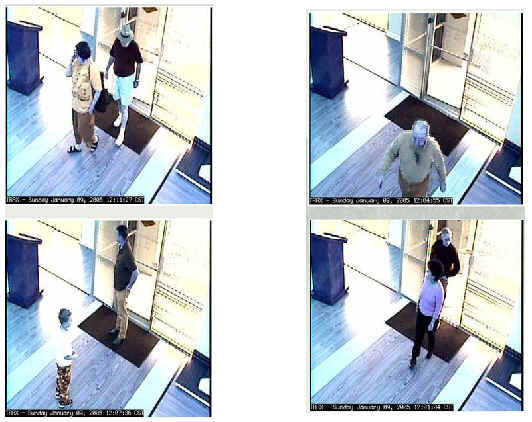
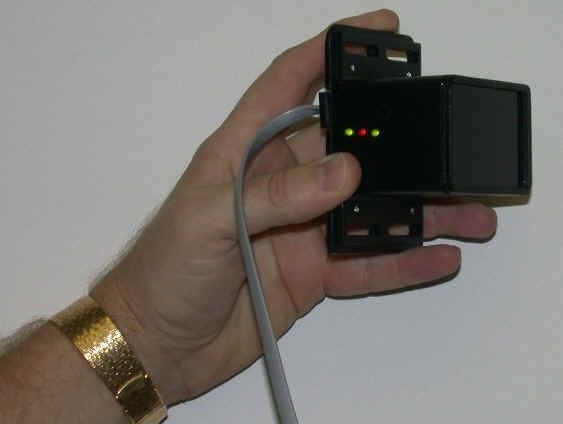
And introducing visual proof, the first camera system that provides 100% accuracy for all activity coming into each store with easy to analyze format, even is you have huge traffic. Each picture is taken 1.25 seconds after the customer walks in. It has a time stamp on each and permits you to scroll through 100s of pictures a minute guarantee 100% accuracy of your traffic counts. Our only goal is to help you break sales records over and over again!!