Capture the Important Information On The Sales YOU DON’T MAKE
TRAXsales.com
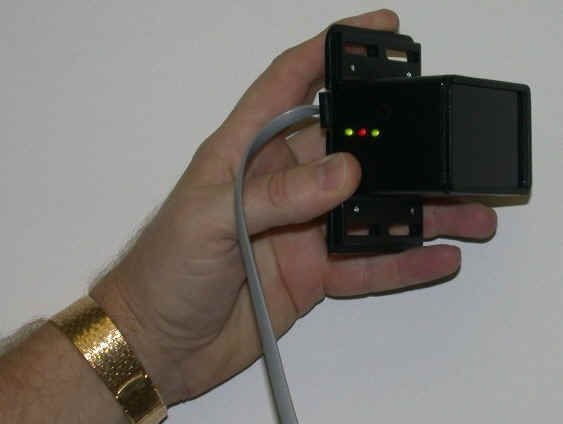
Triple Lens Front Door Traffic Counter
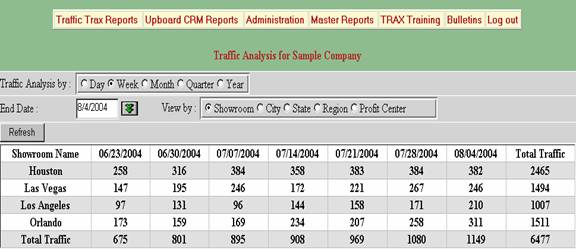
View your customer traffic by hour, day week month or year.
When a customer comes in they are counted but Traffic TRAX has a four second delay, so that if there is a husband and wife and two kids they are still only counted as one opportunity. You may also count every person who walks through if you like. Just ask us to remove the delay before we ship.
When people are leaving they trip the inside beam first and it tells our microprocessor to make them invisible and they are not counted.
Finally we also know that there is some level of non-customer activity throughout the day. The mailman comes in at noon; the UPS guy comes in at two. Salespeople are leaving and coming back from lunch and if there are cigarette smokers you don’t want to count them. So our software automatically subtracts for this non-customer activity. For example we estimate that a five-salesperson showroom will have approximately 26 non-customer counts throughout the day. You can also adjust this any time.
There is also a door chime that may be turned off. It only sounds when customers enter, not when they are leaving.
Have you ever heard?
But
Boss…
The customer traffic died right after you left…
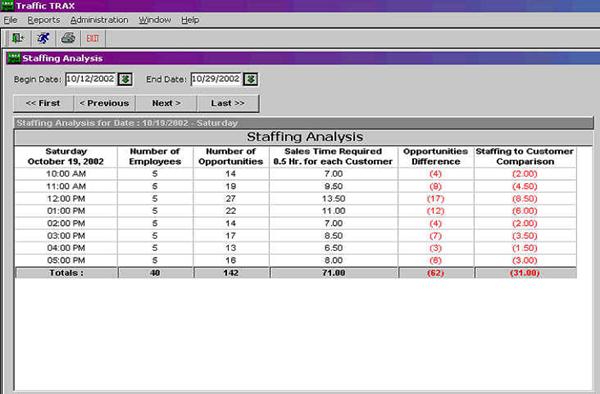
Track Your Hourly Traffic Patterns to Maximize
Staffing and Scheduling
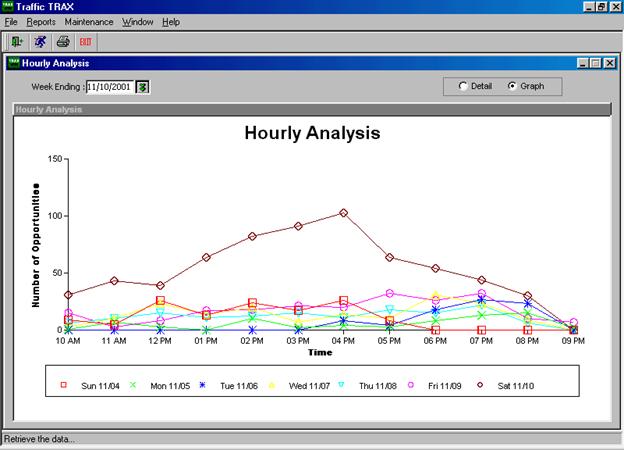
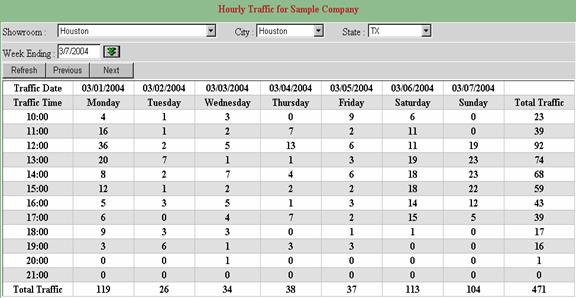
Compare Your Staffing Per Hour To The Number Of Customers Who Visit Each Hour.
This Report May Be Adjusted By The Average Time A Customer Spends In Your Store
The following is a true short story
A large chain of over eighty stores, purchased two of my counters to test and had a very interesting eye opening experience.
The Orlando Location did $374382.42 in sales, the New York store did $504621.89 New York's sales were consistently over Orlando by an average of 20%, but the first month we used the traffic counter they learned that the New York store had 6291 customer opportunities and Orlando had only 2461 customers come in.
In other words New York had over 2 and 1/2 times the number of customers that Orlando talked with. The difference is 3830 extra customers and equals 256% more traffic, and this had been going on for years.
We are talking about millions of lost dollars because of a greedy, stupid manager that was not giving upper management all the facts. New York is easily a million per month store.
In the hands of a good manager this information will increase profitability in any operation by 50% or more, it's really a simple question of proper staffing and good middle management that has their eye on the ball. The question is... do your managers know their true company closing ratios?
TRAX will amaze you with the accuracy and guaranteed performance.
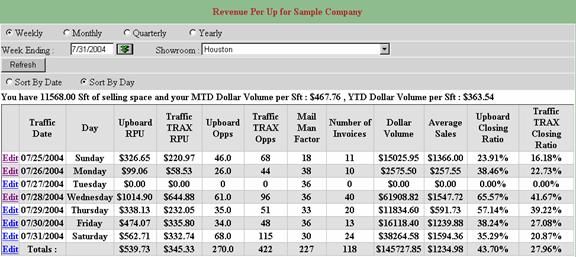
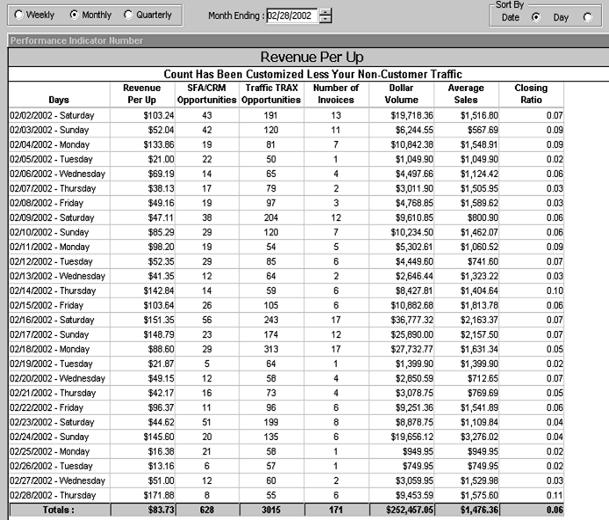
This Is Your Revenue Per Up Report, Which Helps Analyze Your Average Revenue Per Opportunity. RPU Is Your Dollar Volume Divided By Your Number Of Opportunities.
This Calculation Can Also Be Calculated By Multiplying Your Average Sale By Your Closing Ratio
For years so called Industry Experts have been telling us that our closing ratios are 35-45%...
A friend of ours committed to counting his traffic. He had nine salespeople and was generating $600,000 per month in sales. I asked him before the count what he thought his closing ratio was. He immediately said between 35 and 40%. This is a very typical answer in our business. He even called in his sales manager and asked her the same question. I smiled when she said exactly the same thing.
After the first week we learned that they were getting between 25-35 customers per hour on the weekend and his overall closing ratio was 6.09 %.... WOW
He called me and said Dave... I just realized that if I can somehow get my salespeople to sell three more customers per hundred I can increase my overall sales by 50%.
He now has 15 salespeople and recently had a 1.2 million dollar month. That's double folks...and interestingly if you do the math, each salesperson's personal level of sales volume also improved.
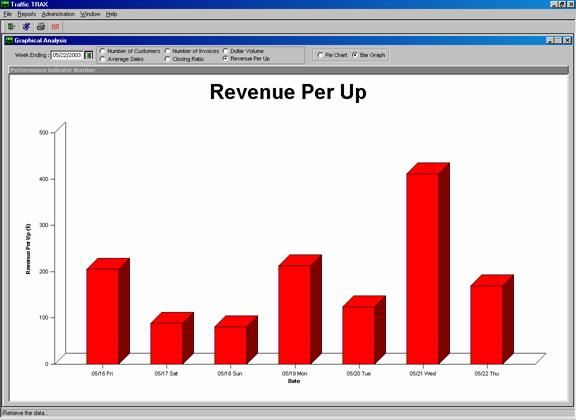
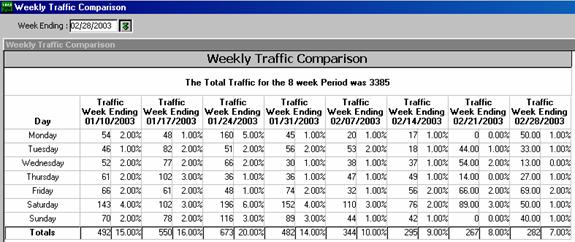
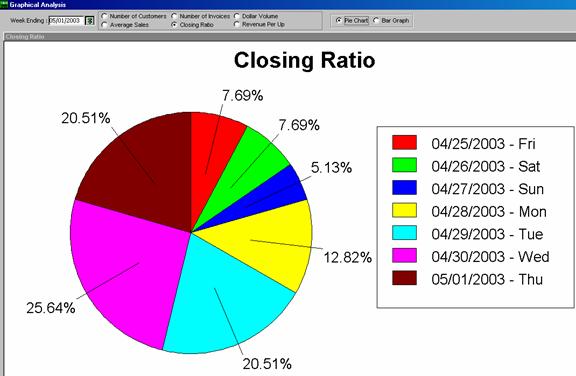
Compare Traffic Patterns To Advertising Dollars Spent. The Question With This Report Is Why Did Traffic Go From Week One From 15% Up To 20% During The Third Week Down To 7% Percentage of Traffic For The Eight Week Period.
Was There A Bad Weather Event Like A Snowstorm, Or Was It A Construction Problem, Or Did The Advertising Simply Fail?
Traffic Counter Description
Our "Retail Traffic Counter" triple lens infrared front door traffic counter is the most accurate and easiest to install you can buy. It links to any PC or direct to your corporate office and provides the automatic reports you need to insure improvement.
We guarantee accuracy within 2-3%, and our pricing is very aggressive. Normally our cost is 1/4 of what you might expect from a company with a product that does less. Our traffic count data is also totally confidential.
For multiple locations our global networking automatically sends the data every our so it is waiting for you on your desk each morning. It permits you to view each store with a single click, then by city, each state, then globally.
We have a 90-day buy back guarantee... If for any reason you are not totally delighted with our systems we buy them back. PERIOD... We want you as a friend and customer for life and we will do what ever it takes to help you improve your business. We believe that if you don't think this is the best business investment you ever made, we don't think you should have to keep it.
Our patent pending triple lens system really works. We can tell if a family of 4 enters and count them as 1 (one) opportunity. When they leave your store they are invisible to the system and are not counted. If you chose we can also count each person who enters. Plus, or should I say (minus) we do not count employees entering or the Mail Man or UPS delivery. Also we do not count people who are already in your store and walk in front of the counter (within 6-12 feet of the door) as they cruise through your showroom and are accidentally counted as other counters may. Our software also permits you to view the customer traffic during the open for business hours you select.
This report provides 3 key pieces of information ...
1. Revenue Per Up.
2. Closing Ratio.
3. Comparison between the # of physical opportunities and those identified by your sales team.
Revenue Per Up (RPU) is the benchmark which provides a monetary assessment of your physical opportunities by drawing a comparison between the total sales dollars and the number of physical opportunities that visited the store. Since there are only two ways to improve the RPU which is by improving the closing ratios or the average sale ratios, you can now track this figure and know immediately if your business is improving or not.
In other words if this showroom was able to change the Revenue Per Up from $83.73 as shown in this example to $167.00 they will double their sales from $252,467 to over $500.000 Trust me, $167 RPU is not that difficult.
Secondly, this report will provide an accurate measurement of your closing ratio based on the # of sales vs. the # of physical opportunities. Often times sales people estimate their closing ratio based on only prospects who they believe will close versus all opportunities. In order to fully understand the dynamics of your traffic, the benchmarks need to be initially focused on physical traffic counts.
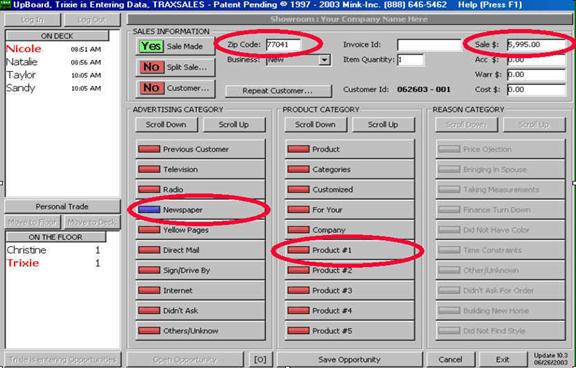
And lastly, by comparing the difference between the # of opportunities counted by the traffic counter and what the salespeople enter into the UpBoard, you now know how many opportunities are not being accounted for by your sales team. More importantly, you now know how many opportunities have slipped through your doors for which you do not have good follow up information for. Without good follow up information, you will not be able to "tap" your "unsold market" which ultimately limits being able to increase your Revenue per Up (RPU) through increased sales derived from this untapped market.
For example, the top line of this report show that 191 physical opportunities were counted by the door counter and only 43 were recorded, therefore 148 opportunities came in but are not accounted for. Imagine if you were able to close .07 of those customers now or in the near future by executing good follow up procedures, that would mean an additional 10 sales. Based on the average sales in this example, an additional $15,000 could potentially have been sold!
Remember - accurate measurement by itself creates awareness and the opportunity for improvement, adding intelligent management compounds this improvement dramatically!
This report can also be sorted by day, so you can look at all of your Saturdays at a single glance.
For Customers Who Are Also Interested In Customer Relationship Management and Sales Force Automation We Have Also Developed The Patented TRAX UpBoard Which Guarantees Better Customer Service And Insures That Each Salesperson Is Far More Profitable Everyday. We guarantee Improvement of a minimum of $5000 Per Salesperson Per Month OR WE BUY IT BACK…
TRAX Helps You
Capture the Important Information On The Sales YOU DON’T MAKE
If You Don’t Know How Many Customers Visit Your Store Each Week And You Don’t Know Your True Closing Ratios, YOU DON’T KNOW YOUR BUSINESS…