Dear Trax
Customer,
Our Goal is to
help you double your profitability FAST...
It is with great excitement that I am writing to you today.
The Trax development team has been working on a several
essential reports for your company. Corporate executives
will find the information contained in these reports
indispensable.
The information that you supply us will generate three key
reports:
Revenue Per Guest- This report will provide you with
accurate conversion rations and Revenue Per Guest Analysis
that will instantly tell you where you are most likely to
create improvement in your company.
Sales Goals Analysis by Sales Person- This report
provides a weekly analysis that is guaranteed to motivate all
salespeople to make an extra effort on the sales floor.

Average Sales Analysis- This report tells management how much
you have lost because below average salespeople need to be
made aware of how much more that they can personally make for
themselves and for the company, if they simply hit the company
average.

The four essential bits of data required are: Employee ID
(provided by Trax, once we have each salesperson's name), Date
of Sale, Total Sales for the day for that salesperson, and the
Total Number of Invoices. All of this information is
sent to us in the Excel template, we provide. Once you
provide Trax with this data for a couple of weeks, you will
see the benefit of this analysis and we will show you how to
automate the process.
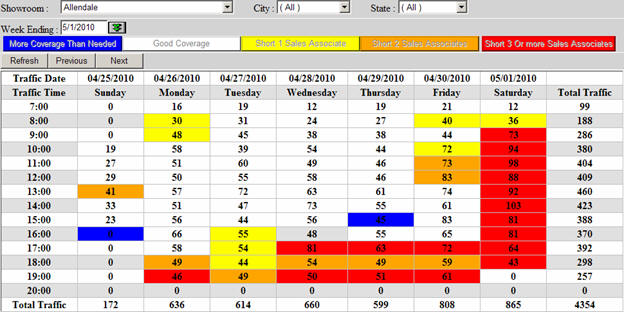
If you also provide a current weekly work schedule for your
sales team, we will populate your "Hot Zone Report."
This report compares your number of employees to the actual
customer traffic every hour. If you have too many hours
that are "Red," "Orange," or "Yellow," you may be losing
money. We have several customers, that use this report
and have experienced a 15% increase in sales volume company
wide, simply by allowing the management team to view this
report and rearrange their store schedules to better
accommodate customers during the stores busiest times. I
must stress that these clients experienced a 15% increase in
gross sales company wide, without increasing any costs.
The link below will provide the necessary information for you
to get started. Our primary goal here at Trax is to help
you increase sales and increase your profits.

Please send all questions and information to George at
support@traxsales.com.
Sincerely yours,
Dave Mink
CEO, Trax Sales
Sample of Excel
Report you need to send to George for the last couple weeks.
I will bet my
hat that these reports and the BABTA (Below Average Brought To
Average) we will show you will create a 20% or more increase
in sales performance across the board for your company.
What do you
have to lose?

Store /
Salesperson / Day/Date 00/00/2010 / Sales Volume for the Day
without sales tax or Delivery / Total number of Transactions
for that day

![]()